Hubble image archive
Photometry of Super-Jupiter 2M1207b
This graph plots small changes in the infrared brightness of a super-Jupiter as measured by the Hubble Space Telescope. The S-shaped curve is extrapolated from the data points. Its sinusoidal shape suggests that brightness changes are a result of a 10-hour rotation period (horizo...
- Date
- Jan 1, 2016
- Mission
- Hubble Space Telescope
- Archive ID
- hubblesite-images-2016-05-3704-image

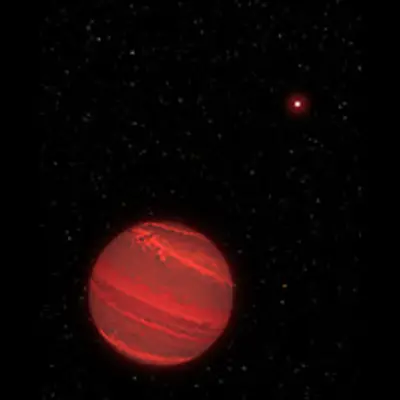
This graph plots small changes in the infrared brightness of a super-Jupiter as measured by the Hubble Space Telescope. The S-shaped curve is extrapolated from the data points. Its sinusoidal shape suggests that brightness changes are a result of a 10-hour rotation period (horizontal axis). The vertical axis shows small changes in brightness. This would mean that the planet likely has patchy clouds that influence the amount of infrared radiation observed as the planet rotates. At a distance of 170 light-years from Earth, the planet is too far away for Hubble to actually resolve atmospheric structure.
Credits
NASA, ESA, Y. Zhou (University of Arizona), and P. Jeffries (STScI)
Downloads
Source
Image and source material are credited to the official mission archive linked below.
View on NASA.gov