Hubble image archive
Expansion of the Universe Over Time
This graph plots the size of the universe over time as measured by the Hubble telescope observations of exploding stars, called supernovas, at various distances from Earth. Hubble's study of exploding stars several light-years from Earth [white objects at far right of curve] set...
- Date
- Jan 1, 2001
- Mission
- Hubble Space Telescope
- Archive ID
- hubblesite-images-2001-09-1034-image
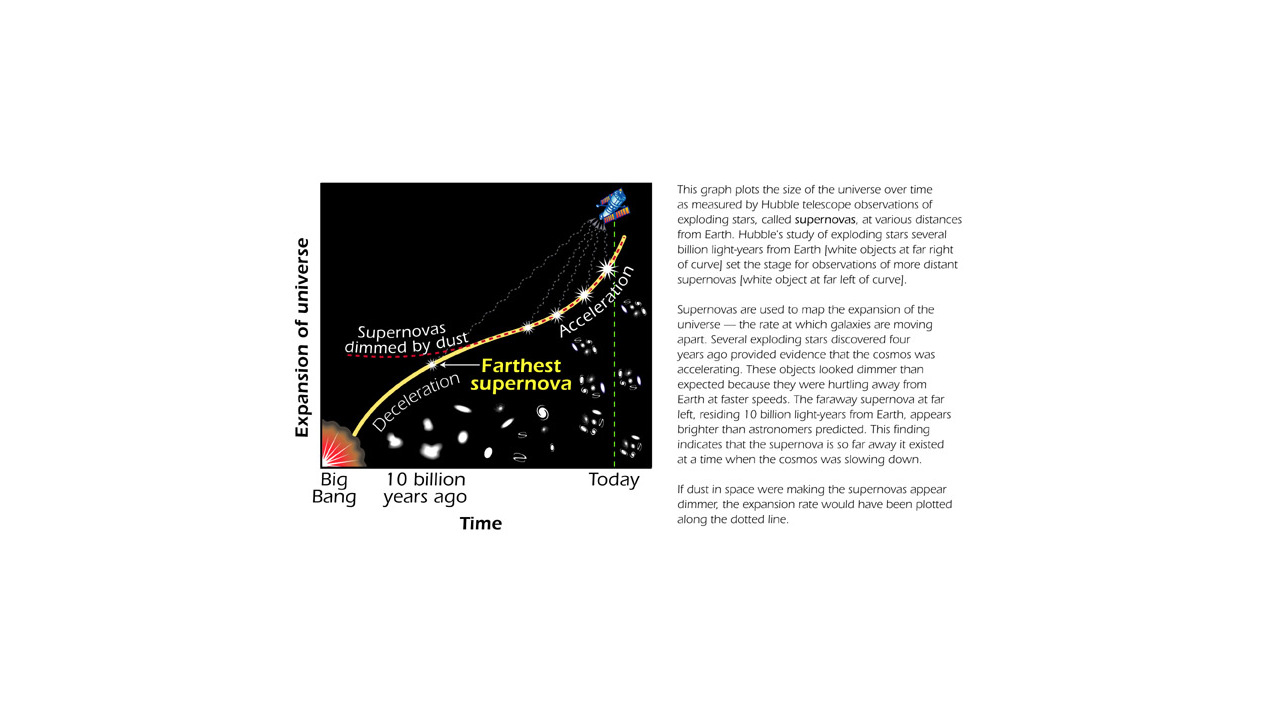
This graph plots the size of the universe over time as measured by the Hubble telescope observations of exploding stars, called supernovas, at various distances from Earth. Hubble's study of exploding stars several light-years from Earth [white objects at far right of curve] set the stage for observations of more distant supernovas [white objects at far left of curve]. Supernovas are used to map the expansion of the universe - the rate at which galaxies are moving apart. Several exploding stars discovered four years ago provided evidence that the cosmos was accelerating. These objects looked dimmer than expected because they were hurling away from Earth at faster speeds. The faraway supernova at far left, residing 10 billion light-years from Earth, appears brighter than astronomers predicted. This finding indicates that the supernova is so far away it existed at a time when the cosmos was slowing down. If dust in space were making the supernovas appear dimmer, the expansion rate would have been plotted along the dotted line.
Credits
Credit: Ann Feild (STScI)
Source
Image and source material are credited to the official mission archive linked below.
View on NASA.gov